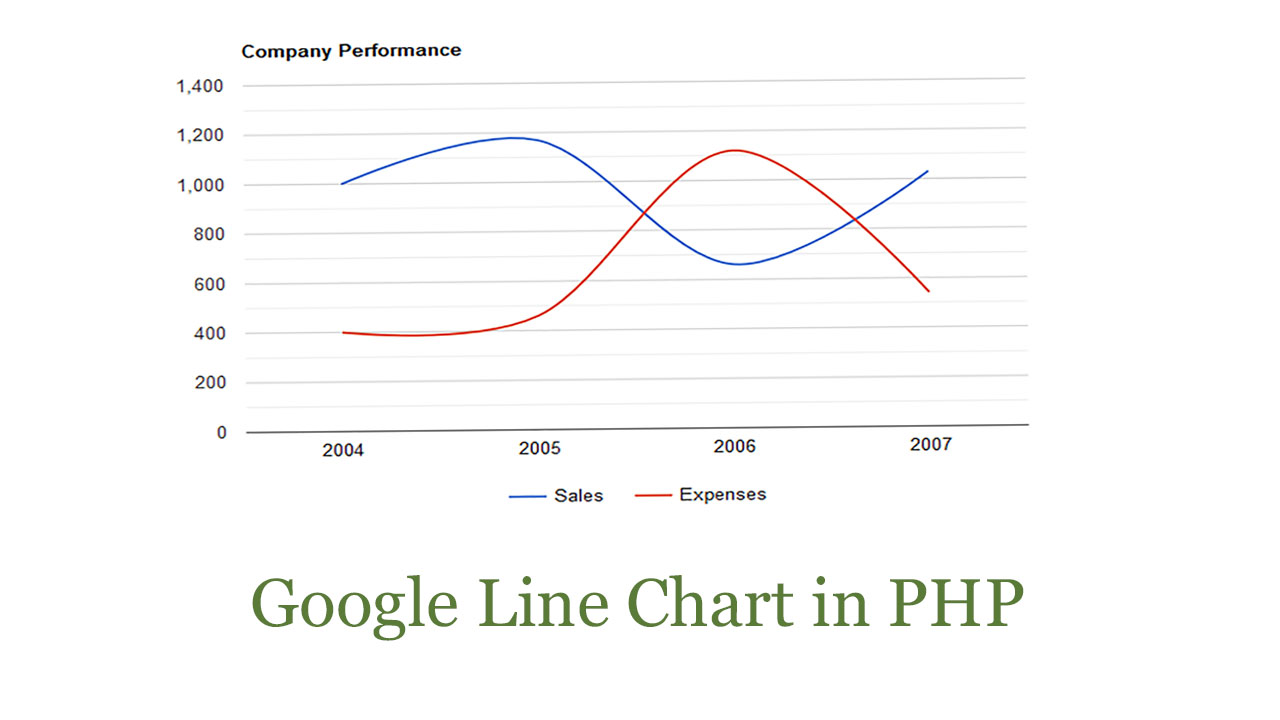
Hello guys, In this blog we learn how to create a google line chart in PHP & MySQL. In easy step by step. So let’s start.
Step 1)
Create a new folder in htdocs give a name as a line-chart in the folder. In the line-chart folder create a new file save as line.php and copy the below code and paste it.
line.php
<html>
  <head>
    <script type="text/javascript" src="https://www.gstatic.com/charts/loader.js"></script>
    <script type="text/javascript">
      google.charts.load('current', {'packages':['corechart']});
      google.charts.setOnLoadCallback(drawChart);

      function drawChart() {
        var data = google.visualization.arrayToDataTable([
          ['Year', 'Sales', 'Expenses'],

          //PHP Code
          <?php
              $query="select * from chart";
              $res=mysqli_query($conn,$query);
              while($data=mysqli_fetch_array($res)){
                $year=$data['year'];
                $sale=$data['sale'];
                $expense=$data['expenses'];
          ?>
           ['<?php echo $year;?>',<?php echo $sale;?>,<?php echo $expense;?>],
          <?php
              }

          ?>

        ]);

        var options = {
          title: 'Company Performance',
          curveType: 'function',
          legend: { position: 'bottom' }
        };

        var chart = new google.visualization.LineChart (document.getElementById('curve_chart'));

        chart.draw(data, options);
      }
    </script>
  </head>
  <body>
    <div id="curve_chart" style="width: 900px; height: 500px"></div>
  </body>
</html>
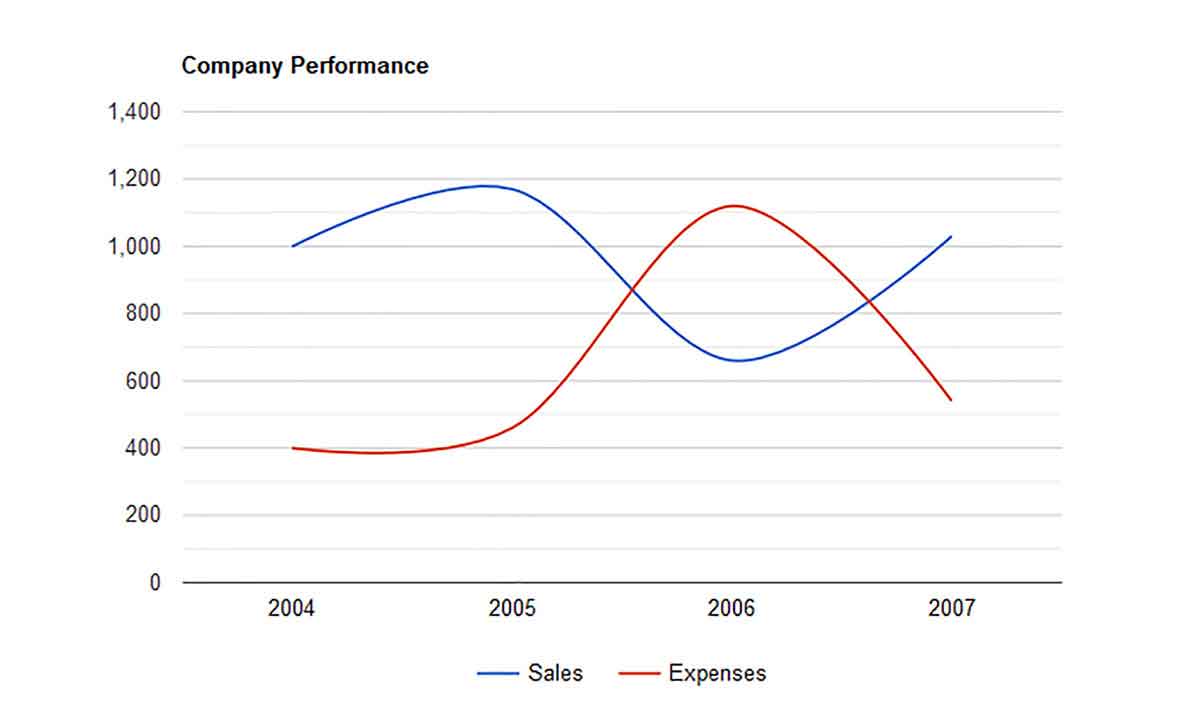
Start Xampp and then type in browser URL http://localhost/line_chart/line.php
your output should look like these. but still is static so now we convert it into dynamic using PHP and MySQL.
Output:-
Step 2) Create a new file given name as db.php and copy the below code in it.
db.php
<?php
$servername="localhost";
$username="root";
$password="";
$dbname="chart";

$conn=new mysqli("$servername","$username","$password","$dbname");

if($conn){

}else{
    echo "Connection Failed";
}
?>
Step 3) Open the browser and type this URL http://localhost/phpmyadmin and hit enter.
Click on Create a new database name as chart and create a chart table in it.
create table chart query:
CREATE TABLE chart
(
  chart_id INT PRIMARY KEY,
  year VARCHAR(255) NOT NULL,
  sale VARCHAR(255) NOT NULL,
  expenses VARCHAR(255) NOT NULL,
);
Table Structure should be Look like these:

Now insert these records in the chart table.
INSERT INTO Chart (year, sale, expenses)
VALUES ('2004', '1000', '400');

INSERT INTO Chart (year, sale, expenses)
VALUES ('2005', '1170', '460');

INSERT INTO Chart (year, sale, expenses)
VALUES ('2006', '660', '1120');

INSERT INTO Chart (year, sale, expenses)
VALUES ('2007', '1030', '540');
Step 4) Now run again the line.php page and your output should look like these dynamically from the table.